Convergence Problems with the rma.mv() Function
Model fitting with the rma.mv() function makes use of iterative methods that attempt to maximize the log likelihood function over the model parameters. The optimization techniques that are used for this purpose sometimes do not converge, in which case the function will inform the user that the optimizer did not achieve convergence. Below, I illustrate this problem with an example and discuss some remedies.
Example
Consider the following dataset:
library(metafor)
dat <- structure(list(study = c(1L, 2L, 2L, 2L, 2L, 2L, 3L, 4L, 5L, 6L, 6L,
6L, 7L, 7L, 7L, 7L, 7L, 8L, 8L, 9L, 9L, 9L, 9L, 10L, 10L, 10L, 10L, 11L, 12L,
12L, 12L, 12L, 13L, 14L, 14L, 15L, 15L, 16L, 17L, 17L, 17L, 17L, 18L, 19L,
19L, 20L), id = 1:46, yij = c(0.686, 0.672, 0.742, 0.914, 0.861, 0.676, 0.711,
0.688, 0.355, 0.774, 1.067, 0.869, 1.121, 0.328, 0.559, 0.62, 0.442, 0.299,
0.387, 0.376, 0.44, 0.414, 0.414, 0.39, 0.061, 0.334, -0.015, 0.508, 0.958,
0.256, 0.539, 0.941, 0.57, 0.308, 0.274, 0.834, 0.633, 0.195, 0.504, 0.216,
0.545, 0.069, 0.097, 0.662, 0.633, 0.317 ), vij = c(0.085, 0.007, 0.085,
0.026, 0.076, 0.028, 0.074, 0.024, 0.085, 0.027, 0.053, 0.054, 0.055, 0.045,
0.014, 0.078, 0.095, 0.028, 0.029, 0.084, 0.017, 0.064, 0.084, 0.05, 0.067,
0.059, 0.092, 0.027, 0.082, 0.096, 0.086, 0.049, 0.056, 0.042, 0.016, 0.068,
0.006, 0.085, 0.041, 0.048, 0.073, 0.048, 0.066, 0.009, 0.016, 0.085)), class
= "data.frame", row.names = c(NA, -46L))
dat
   study id   yij   vij
1      1  1 0.686 0.085
2      2  2 0.672 0.007
3      2  3 0.742 0.085
4      2  4 0.914 0.026
5      2  5 0.861 0.076
6      2  6 0.676 0.028
7      3  7 0.711 0.074
8      4  8 0.688 0.024
9      5  9 0.355 0.085
10     6 10 0.774 0.027
11     6 11 1.067 0.053
12     6 12 0.869 0.054
13     .  .     .     .
Variable yij contains the effect sizes and variable vij the corresponding sampling variances. The dataset has a multilevel structure, with some studies providing multiple effect size estimates (e.g., study 2 provides 5 estimates). Leaving aside further details, a sensible model for these data may be a multilevel random-effects model, which we can fit with:
res <- rma.mv(yij, vij, random = ~ 1 | study / id, data=dat)
Unfortunately, this yields the error:
Error : Optimizer (nlminb) did not achieve convergence (convergence = 1).
Hence, the algorithm used for the model fitting (which by default is the nlminb() function, which uses a Quasi-Newton method for the optimization) did not converge with the default settings.
By setting verbose=TRUE, we can obtain information on the progress of the optimization algorithm:
res <- rma.mv(yij, vij, random = ~ 1 | study / id, data=dat, verbose=TRUE)
Iteration 0     ll = -0.6174   sigma2 = 0.0107  0.0107
Iteration 1     ll = -0.6174   sigma2 = 0.0107  0.0107
...
Iteration 7     ll =  0.7454   sigma2 = 0.0224  0.0054
...
Iteration 14    ll =  1.3502   sigma2 = 0.0283  0.0015
...
Iteration 21    ll =  1.4727   sigma2 = 0.0222  0.0008
...
Iteration 56    ll =  1.6225   sigma2 = 0.0252  0.0000
...
Iteration 124   ll =  1.6284   sigma2 = 0.0252  0.0000
Iteration 125   ll =  1.6285   sigma2 = 0.0252  0.0000
...
Iteration 126   ll =  1.6285   sigma2 = 0.0252  0.0000
Iteration 306   ll =  1.6285   sigma2 = 0.0252  0.0000
Starting around iteration 126, there is no further change in the log likelihood when rounded to 4 decimal places (and neither in the two variance components that are estimated), but nlminb() uses a much smaller threshold for determining when convergence has occurred.
Via the control argument, one can adjust the settings of the optimizer that is used. For example, reading help(nlminb) reveals that one can adjust the number of iterations via the iter.max control argument (which by default is 150). So let's try increasing this to something larger:
res <- rma.mv(yij, vij, random = ~ 1 | study / id, data=dat,
              verbose=TRUE, control=list(iter.max=1000))
The output (not shown) is the same as before, so this didn't really help with achieving convergence. The problem in this case is the rather small threshold that is used by default for determining whether the change in the log likelihood is small enough to declare that convergence has occurred. As we see above, convergence actually seems to occur, but is not detected by the algorithm. Let's try a slightly less strict threshold by adjusting rel.tol (which by default is 1e-10):
res <- rma.mv(yij, vij, random = ~ 1 | study / id, data=dat,
              verbose=TRUE, control=list(rel.tol=1e-8))
res
Now the error disappears and the output shows that convergence was reached after 226 iterations. We can then proceed to examine the results:
Multivariate Meta-Analysis Model (k = 46; method: REML)

Variance Components:

            estim    sqrt  nlvls  fixed    factor
sigma^2.1  0.0252  0.1588     20     no     study
sigma^2.2  0.0000  0.0000     46     no  study/id

Test for Heterogeneity:
Q(df = 45) = 68.9392, p-val = 0.0124

Model Results:

estimate      se     zval    pval   ci.lb   ci.ub
  0.5245  0.0488  10.7373  <.0001  0.4288  0.6203  ***

---
Signif. codes:  0 '***' 0.001 '**' 0.01 '*' 0.05 '.' 0.1 ' ' 1
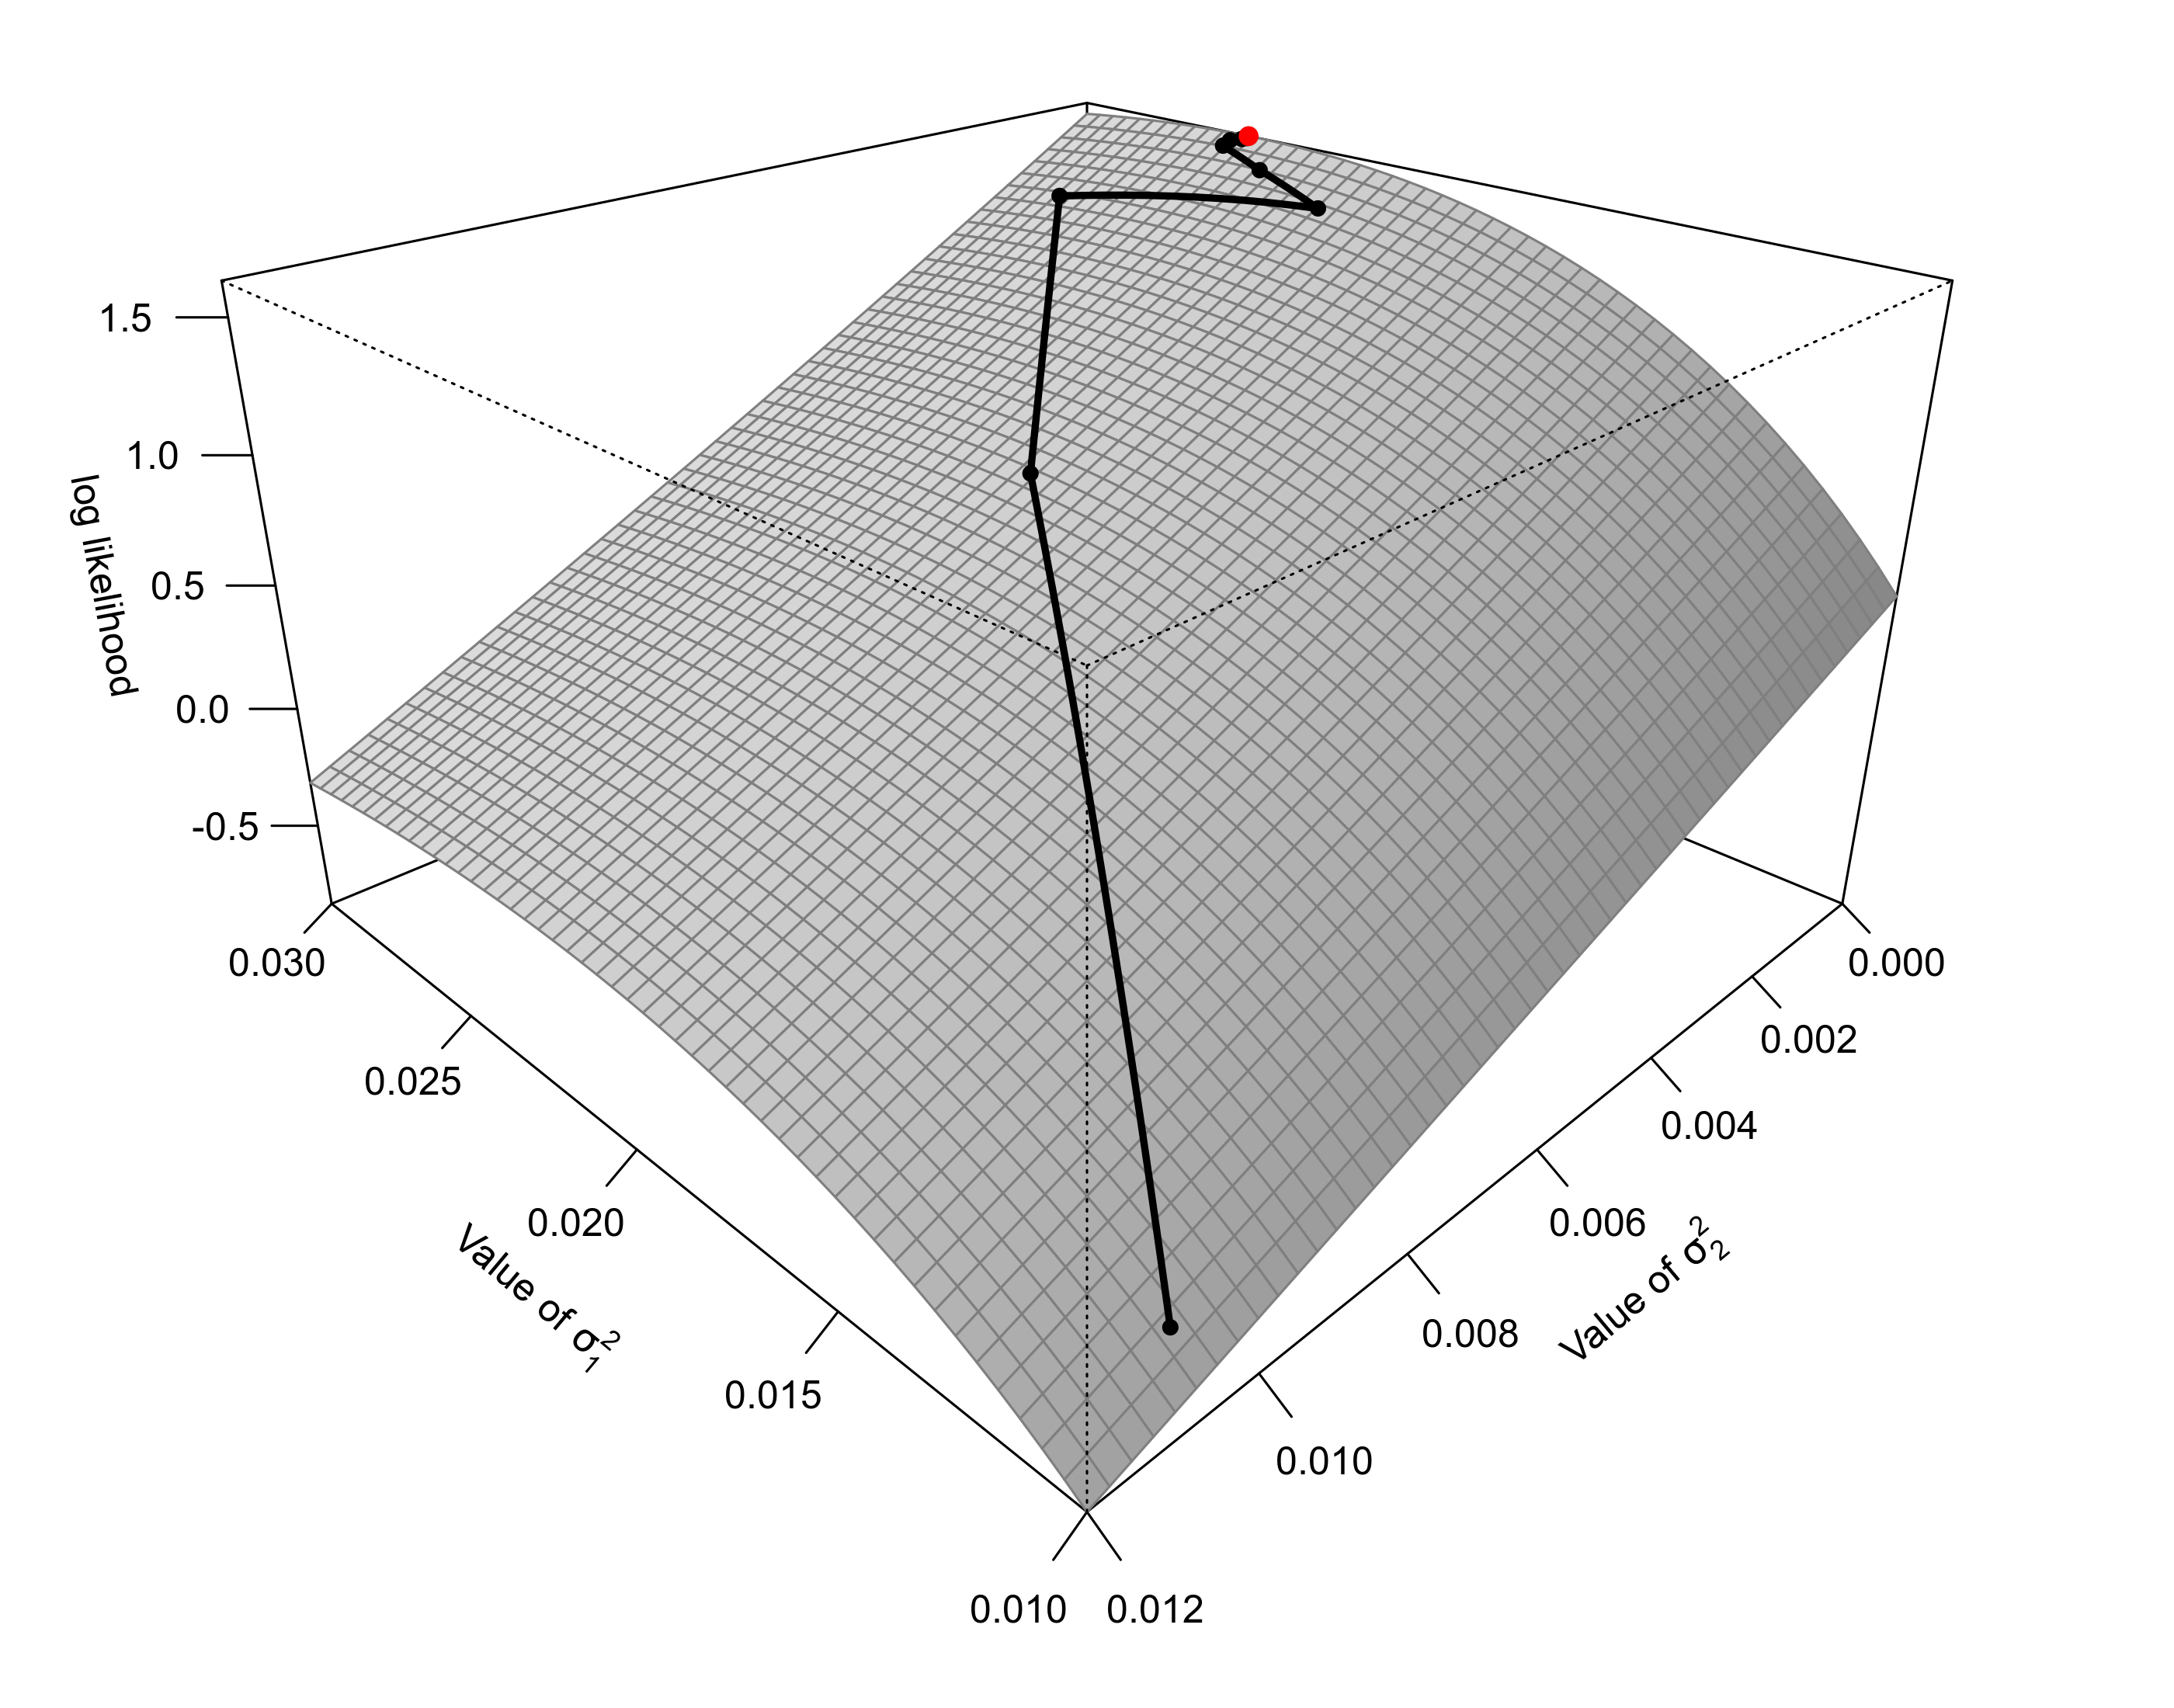
We see that the second variance component ($\sigma^2_1$), which provides an estimate of the amount of within-study heterogeneity, converged to (essentially) 0. There is nothing inherently wrong with this (it could very well be the case that all of the heterogeneity in these data is due to differences between studies and none due to differences in the effect sizes within studies), but whenever parameter estimates are drifting towards bounds like this, it does make life more difficult for the optimization routines.
The figure below shows the (restricted) log likelihood surface for these data/model as a function of the two variance components. The black line indicates the path that the optimizer takes over the surface, eventually reaching the maximum at the red dot (for an animated version of this figure, click here).
Instead of adjusting the settings of the default optimizer, we can also try switching to a different optimization routine. The rma.mv() function actually provides access to more than a dozen different optimizers, which can be chosen via the optimizer control argument. Below, I fit the same model as above, trying out 12 other optimizers (besides the default one). Where necessary, I adjusted some other settings to achieve convergence with all of the optimizers.
res <- list(
rma.mv(yij, vij, random = ~ 1 | study / id, data=dat, control=list(optimizer="nlminb", rel.tol=1e-8)),
rma.mv(yij, vij, random = ~ 1 | study / id, data=dat, control=list(optimizer="Nelder-Mead")),
rma.mv(yij, vij, random = ~ 1 | study / id, data=dat, control=list(optimizer="BFGS")),
rma.mv(yij, vij, random = ~ 1 | study / id, data=dat, control=list(optimizer="bobyqa")),
rma.mv(yij, vij, random = ~ 1 | study / id, data=dat, control=list(optimizer="nloptr", maxeval=1000)),
rma.mv(yij, vij, random = ~ 1 | study / id, data=dat, control=list(optimizer="nlm")),
rma.mv(yij, vij, random = ~ 1 | study / id, data=dat, control=list(optimizer="hjk")),
rma.mv(yij, vij, random = ~ 1 | study / id, data=dat, control=list(optimizer="nmk")),
rma.mv(yij, vij, random = ~ 1 | study / id, data=dat, control=list(optimizer="mads")),
rma.mv(yij, vij, random = ~ 1 | study / id, data=dat, control=list(optimizer="ucminf")),
rma.mv(yij, vij, random = ~ 1 | study / id, data=dat, control=list(optimizer="lbfgsb3c")),
rma.mv(yij, vij, random = ~ 1 | study / id, data=dat, control=list(optimizer="subplex")),
rma.mv(yij, vij, random = ~ 1 | study / id, data=dat, control=list(optimizer="BBoptim")))
We can then extract the log likelihood and estimates of the two variance components and put everything into a data frame as follows:
tab <- lapply(res, function(x) data.frame(optimizer=x$control$optimizer, ll=logLik(x),
                                          sigma2.1=x$sigma2[1], sigma2.2=x$sigma2[2]))
tab <- do.call(rbind, tab)
dfround(tab, digits=5)
     optimizer      ll sigma2.1 sigma2.2
1       nlminb 1.62847  0.02522        0
2  Nelder-Mead 1.62847  0.02522        0
3         BFGS 1.62830  0.02522        0
4       bobyqa 1.62847  0.02522        0
5       nloptr 1.62841  0.02522        0
6          nlm 1.62847  0.02522        0
7          hjk 1.62847  0.02522        0
8          nmk 1.62847  0.02523        0
9         mads 1.62847  0.02522        0
10      ucminf 1.62847  0.02522        0
11    lbfgsb3c 1.62847  0.02522        0
12     subplex 1.62847  0.02522        0
13     BBoptim 1.62847  0.02522        0
We can see some minor discrepancies between some of the log likelihood values, but the results are essentially identical for all optimizers.
Given that some other optimizers converged without any adjustments to their default settings, one might wonder why nlminb() is the default optimizer in rma.mv() (which did require some tweaking to achieve convergence in this example). The example above was constructed specifically to lead to non-convergence with nlminb() under its default settings. For many other datasets, nlminb() will converge without difficulties, while some of the other optimizers might struggle. There is simply not a single algorithm that works flawlessly in all cases. In my experience, nlminb() is actually a quite reasonable and robust default choice and typically works without problems.