Package News
2026-06-21: Forest Plot in Orchard Style
Another way to deal with large meta-analytic datasets is to draw so-called ‘orchard plots’. In contrast to standard forest plots, the estimates are shown without their corresponding CI bounds in a bee swarm style around the pooled estimate, with the pooled estimate superimposed on the points (with 95% CI/PI bounds). Often, the estimates are then grouped by some categorical moderator of interest. An example of such a plot is shown here.
2026-06-18: Forest Plot with Grouped Estimates
When dealing with large meta-analytic datasets where studies may contribute multiple effect size estimates to the same analysis, standard forest plots can become excessively large (or the size of the elements in the plot become very small). One possible solution to this problem is to group the estimates from the same study together, omitting the text annotations (i.e., the estimate and corresponding confidence interval bounds) for the individual estimates. A bit of color can be used to make the grouping of the estimates within studies more visually apparent. I have added an example illustrating this possibility here. Note that you will need to install the development version of the metafor package for the example, as I just recently added the colci argument to the various forest() functions in the package.
2026-04-27: The ‘Random-Effects Mantel-Haenszel Method’ in Cochrane Reviews
I was recently asked about the ‘random-effects Mantel-Haenszel method’ that you often see in Cochrane Reviews. The method isn't directly implemented in metafor, but it is quite easy to reproduce its results. Note that this method is really just a standard random-effects model, but it uses a slightly different estimator of $\tau^2$ (based on the DerSimonian-Laird estimator, but using a slightly different Q-statistic). I wrote up a little tutorial to illustrate this here.
2026-04-27: Version 5.0-1 Released on CRAN
A new version (version 5.0-1) of the metafor has been released to CRAN. This version includes various smaller improvements and a few minor bug fixes. A few highlights:
In version 4.8-0, I added various methods for visualizing the prediction interval from a random-effects model (via the predstyle argument), including a dotted line through the summary polygon, a solid or shaded bar below the summary polygon, and by showing the entire predictive distribution. For completeness sake, I have now added another method that has also been used in the past, namely using a polygon also for the prediction interval:
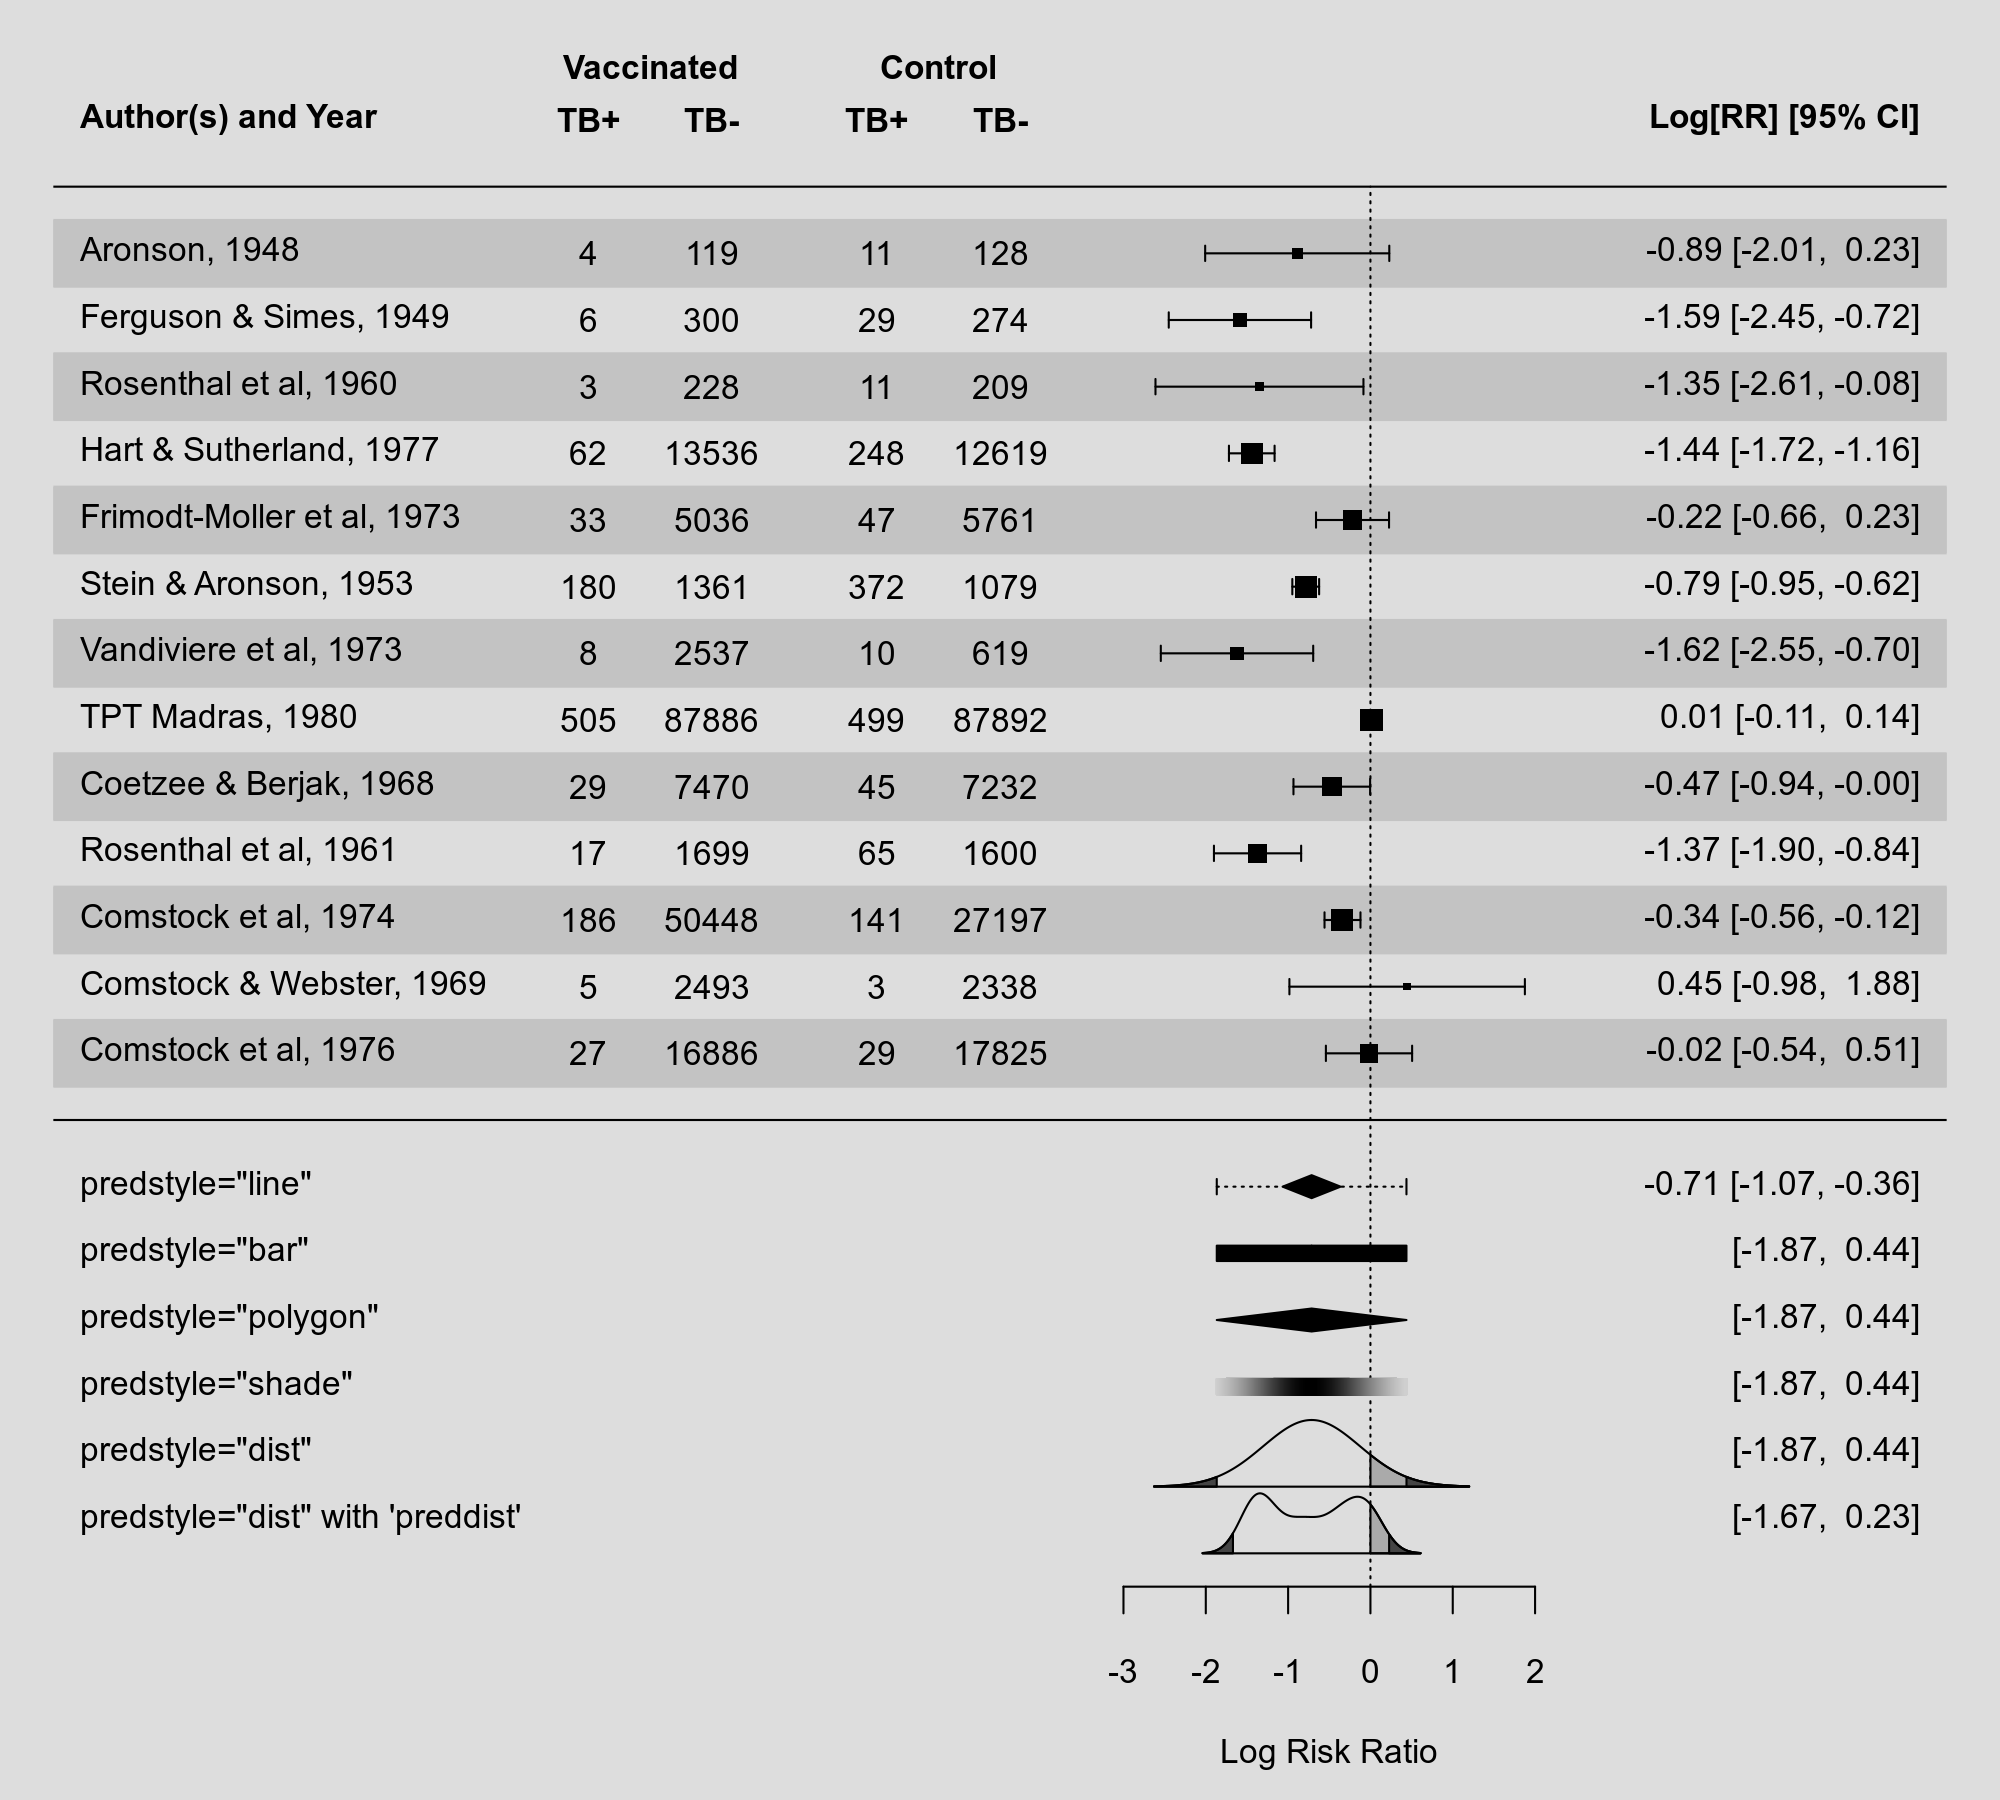
My preference these days is still to plot of the entire predictive distribution, but this gives more options to the user.
Speaking of predictive distributions: One can now use the preddist argument in forest() and addpoly() to provide the predictive distribution directly. This is useful if the distribution was estimated using other methods (e.g., non-parametrically). You can see an example of this above. I recently gave a talk at the European Congress of Methodology where I discuss these different types of visualizations and options in more detail (you can find the slides (and code) for this talk on my website under my presentations).
The deltamethod() function also received a slight update. The delta method is a very general method for deriving the standard error of transformed variables that are asymptotically normally distributed. This is incredibly useful not just for meta-analysis, but more broadly in statistics. The function can now also do the second-order delta method (i.e., using a second-order Taylor expansion), which can be more accurate compared to the standard first-order method (although that is not always the case).
Related to this, one can also derive bias corrections based on the second-order Taylor expansion. Based on recent research, it has been found that certain effect size measures can benefit from such bias corrections. As a result, for measures "ROM", "ROMC", "CVR", and "CVRC", such bias corrections are now applied by default in escalc(). In principle, this is a non-backwards compatible change, which I try to avoid as much as possible, but in this case I did make an exception. However, one can switch off the use of these bias corrections with correct=FALSE, so adjusting to the former behavior is easy.
For a more aesthetic change: Some functions (e.g., vcalc() and rcalc()) now return variance-covariance matrices as objects of class "vcovmat". Such matrices often have a certain structure to them (e.g., block-diagonal with zero entries for the off-diagonal elements). It is easier to recognize such structures when printing such matrices by using dots in place of the zero elements, which is now done with a print method (i.e., print.vcovmat()) for such objects.
Finally, an addition was made to the conv.2x2(), which can be useful for reconstructing 2x2 tables based on other summary statistics. Now the function can also reconstruct tables for diagnostic studies based on various diagnostic statistics (i.e., sensitivity, specificity, and/or the positive/negative predictive value).
The full changelog can be found here.