Table of Contents
Funnel Plot Variations
Description
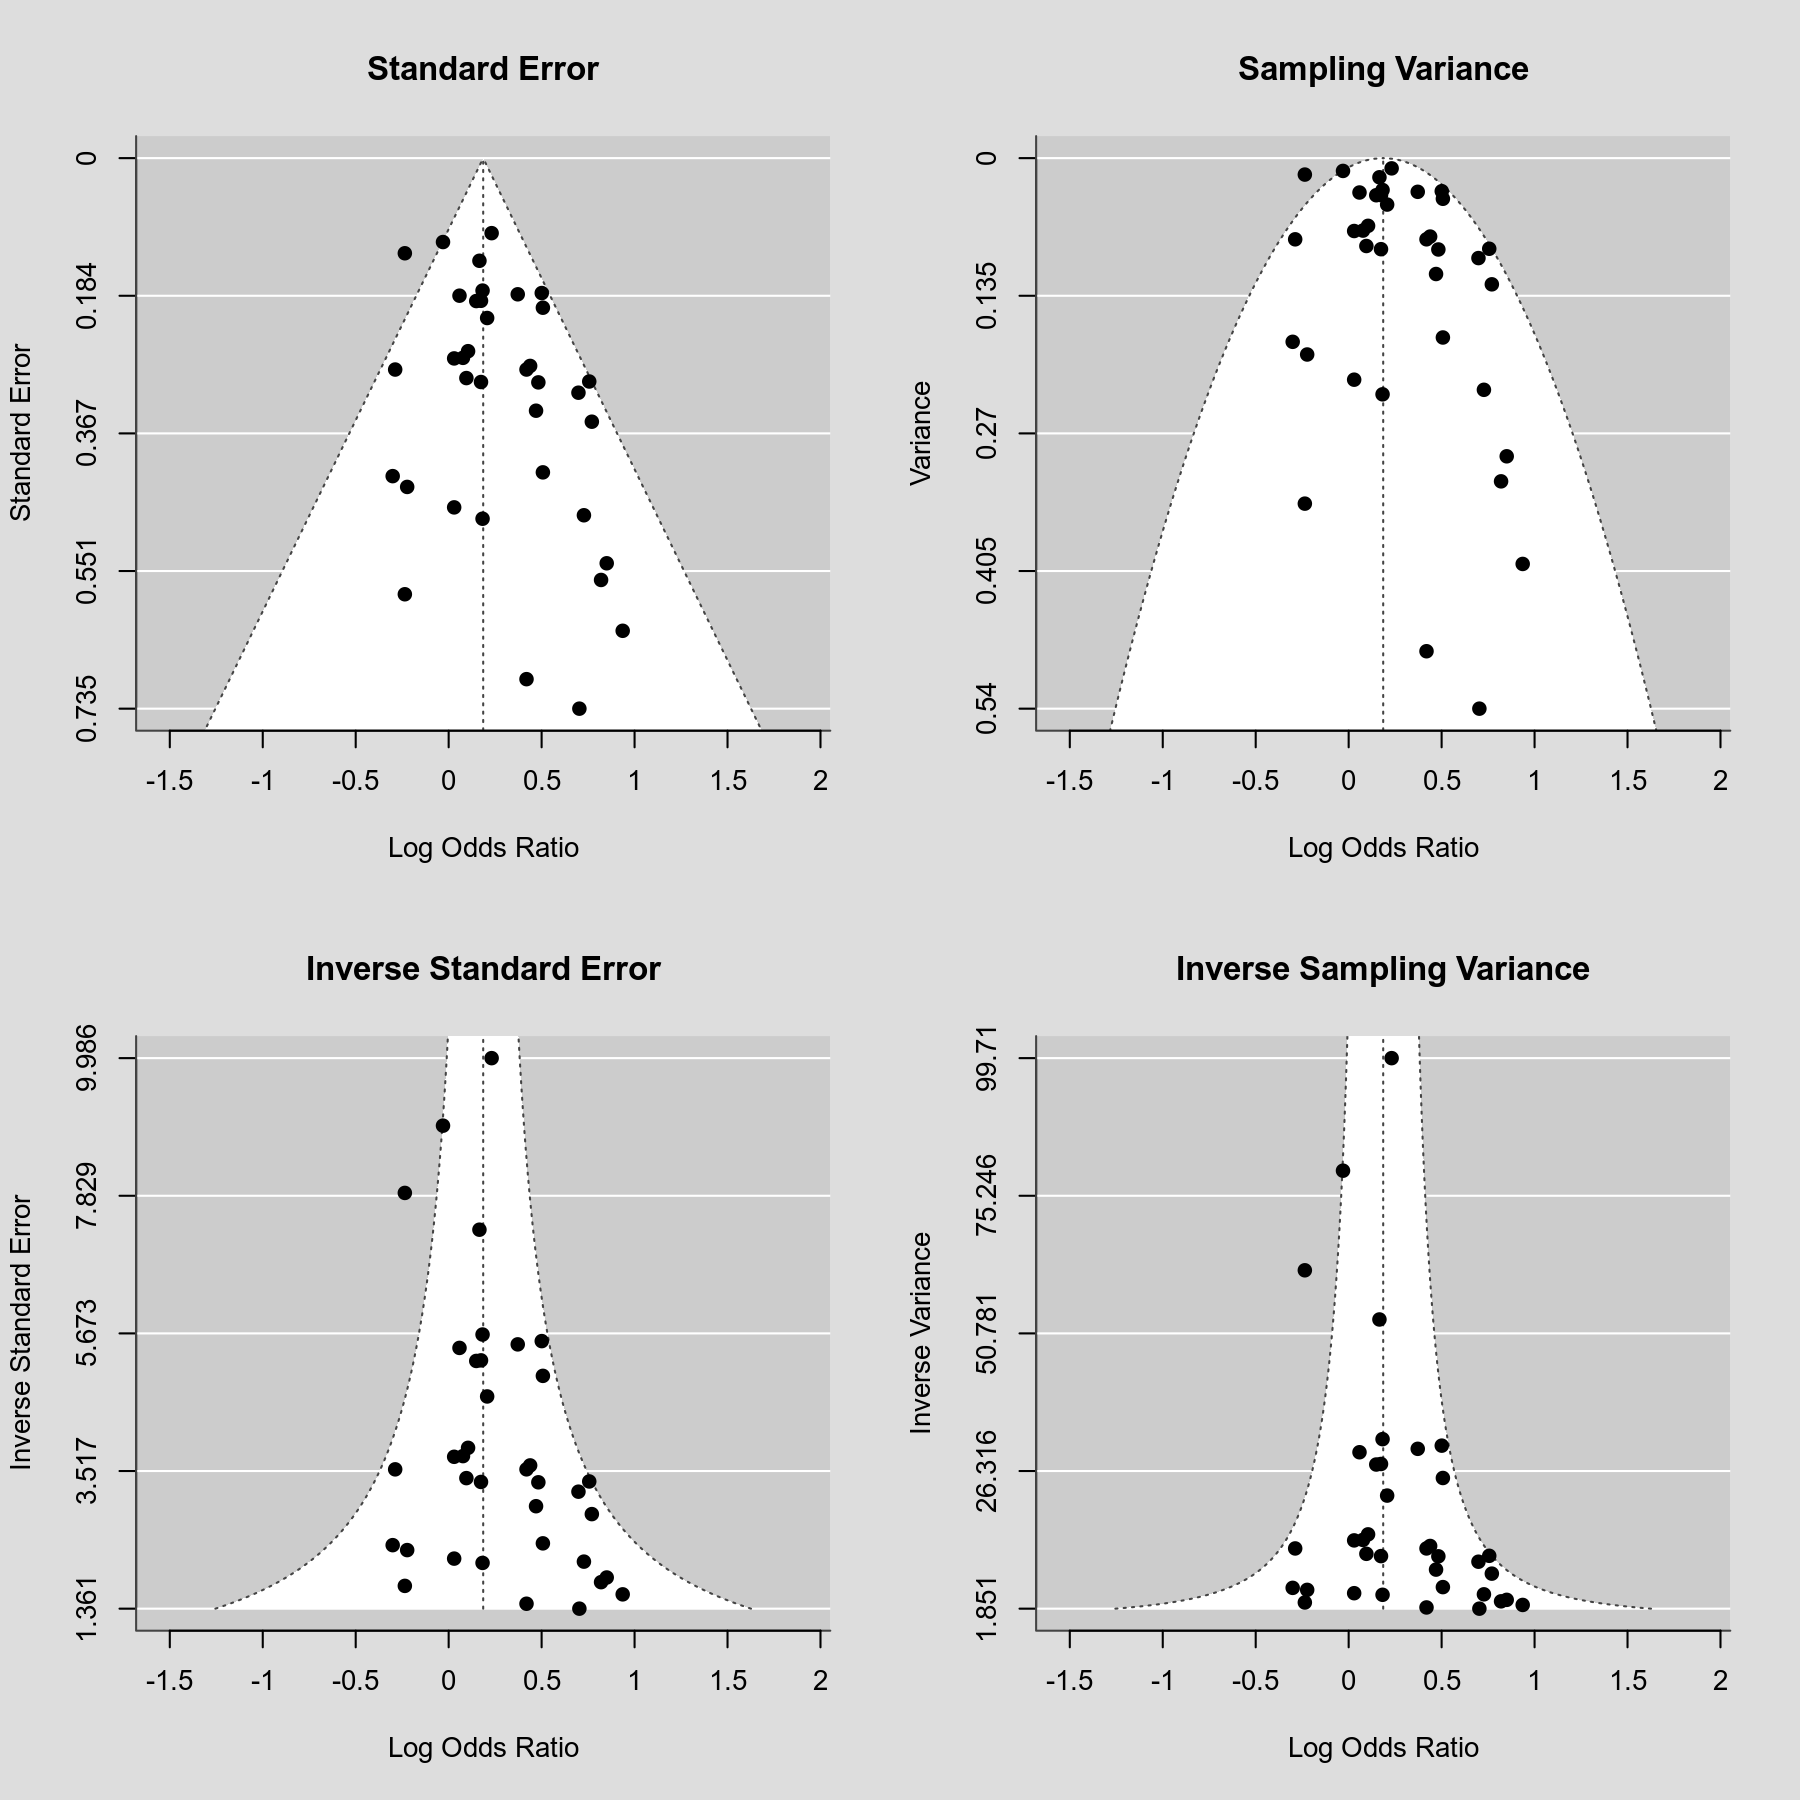
A funnel plot shows the observed effect sizes or outcomes on the x-axis against some measure of precision of the observed effect sizes or outcomes on the y-axis. Based on Sterne and Egger (2001), the recommended choice for the y-axis is the standard error (in decreasing order) and this is also the default for the funnel() function in the metafor package. In the absence of publication bias and heterogeneity, one would then expect to see the points forming a funnel shape, with the majority of the points falling inside of the pseudo-confidence region with bounds $\hat{\theta} \pm 1.96 SE$, where $\hat{\theta}$ is the estimated effect or outcome based on an equal-effects model and $SE$ is the standard error value from the y-axis. With other measures of precision for the y-axis, the expected shape of the funnel can be rather different. The plot below shows a variety of choices for the y-axis and how this impacts the shape of the funnel plot (and the form of the pseudo-confidence region).
Plot
Code
library(metafor)

### fit equal-effects model
res <- rma(yi, vi, data=dat.hackshaw1998, measure="OR", method="EE")

### set up 2x2 array for plotting
par(mfrow=c(2,2))

### draw funnel plots
funnel(res, main="Standard Error")
funnel(res, yaxis="vi", main="Sampling Variance")
funnel(res, yaxis="seinv", main="Inverse Standard Error")
funnel(res, yaxis="vinv", main="Inverse Sampling Variance")
References
Sterne, J. A. C., & Egger, M. (2001). Funnel plots for detecting bias in meta-analysis: Guidelines on choice of axis. Journal of Clinical Epidemiology, 54(10), 1046–1055.