Table of Contents
Meta-Analytic Scatter Plot (Bubble Plot)
Description
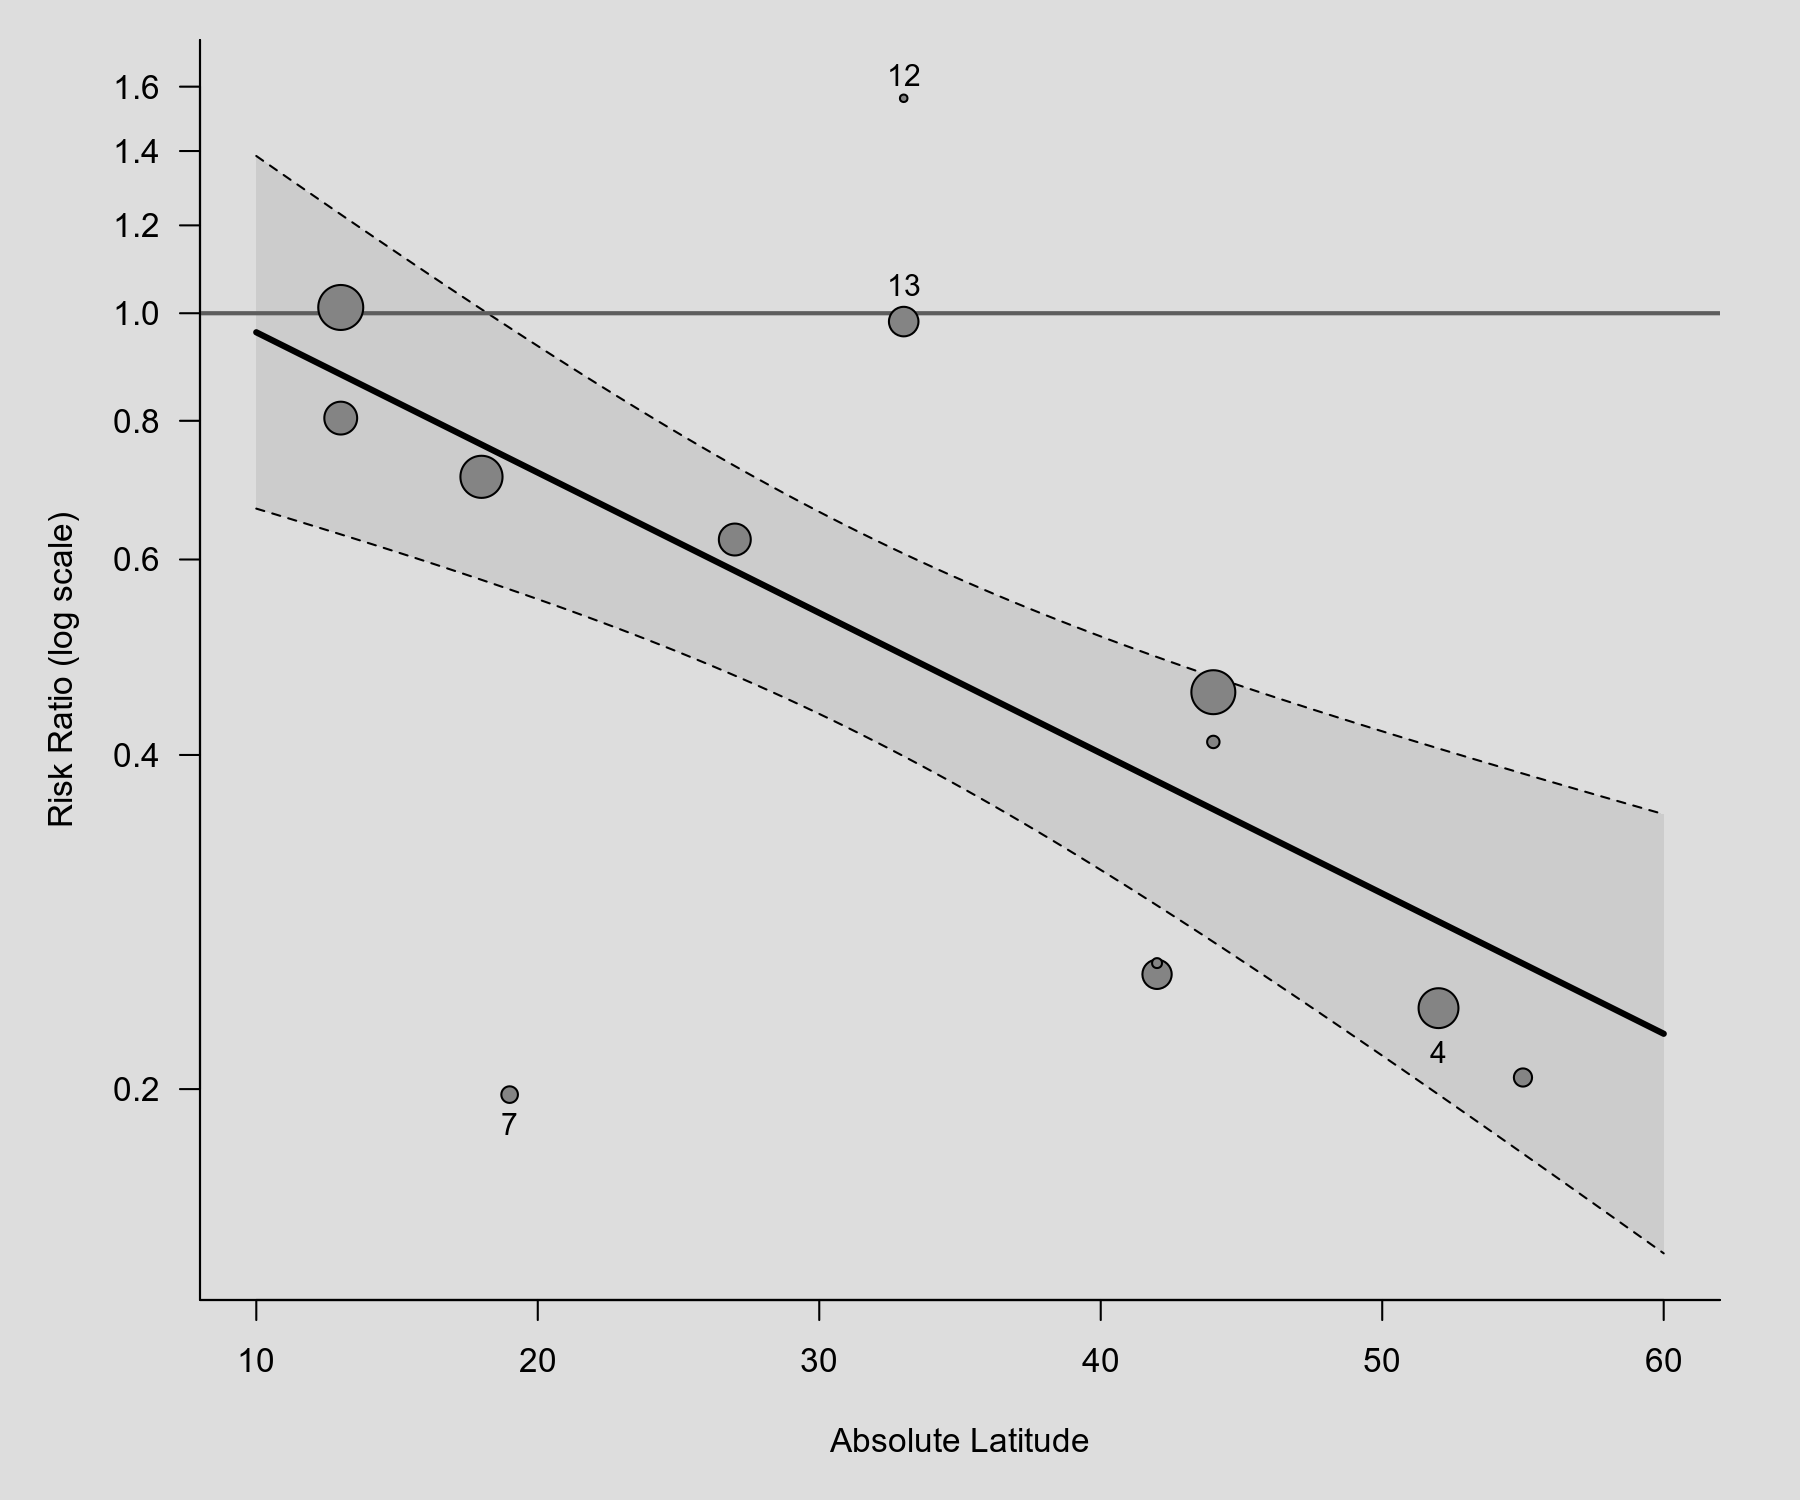
Below is an example of a scatter plot (also known as a bubble plot), showing the observed outcomes (i.e., risk ratios) of the individual studies plotted against a quantitative predictor (i.e., the absolute latitude of the study locations). The size of the points is drawn proportional to the weight that the studies received in the analysis (with larger points for studies that received more weight). Based on the mixed-effects meta-regression model, the predicted average risk ratio as a function of the predictor is also shown in the plot (with corresponding 95% confidence interval bounds). The plot below is similar to Figure 1 in Berkey et al. (1995).
Plot
Code
library(metafor)

### calculate (log) risk ratios and corresponding sampling variances
dat <- escalc(measure="RR", ai=tpos, bi=tneg, ci=cpos, di=cneg, data=dat.bcg)

### fit mixed-effects model with absolute latitude as predictor
res <- rma(yi, vi, mods = ~ ablat, data=dat)

### draw plot
regplot(res, xlim=c(10,60), predlim=c(10,60), xlab="Absolute Latitude", refline=0,
        atransf=exp, at=log(seq(0.2,1.6,by=0.2)), digits=1, las=1, bty="l",
        label=c(4,7,12,13), offset=c(1.6,0.8), labsize=0.9)
References
Berkey, C. S., Hoaglin, D. C., Mosteller, F., & Colditz, G. A. (1995). A random-effects regression model for meta-analysis. Statistics in Medicine, 14(4), 395–411.