plots:forest_plot_with_textpos
Table of Contents
Forest Plot with Adjusted Text Position
Description
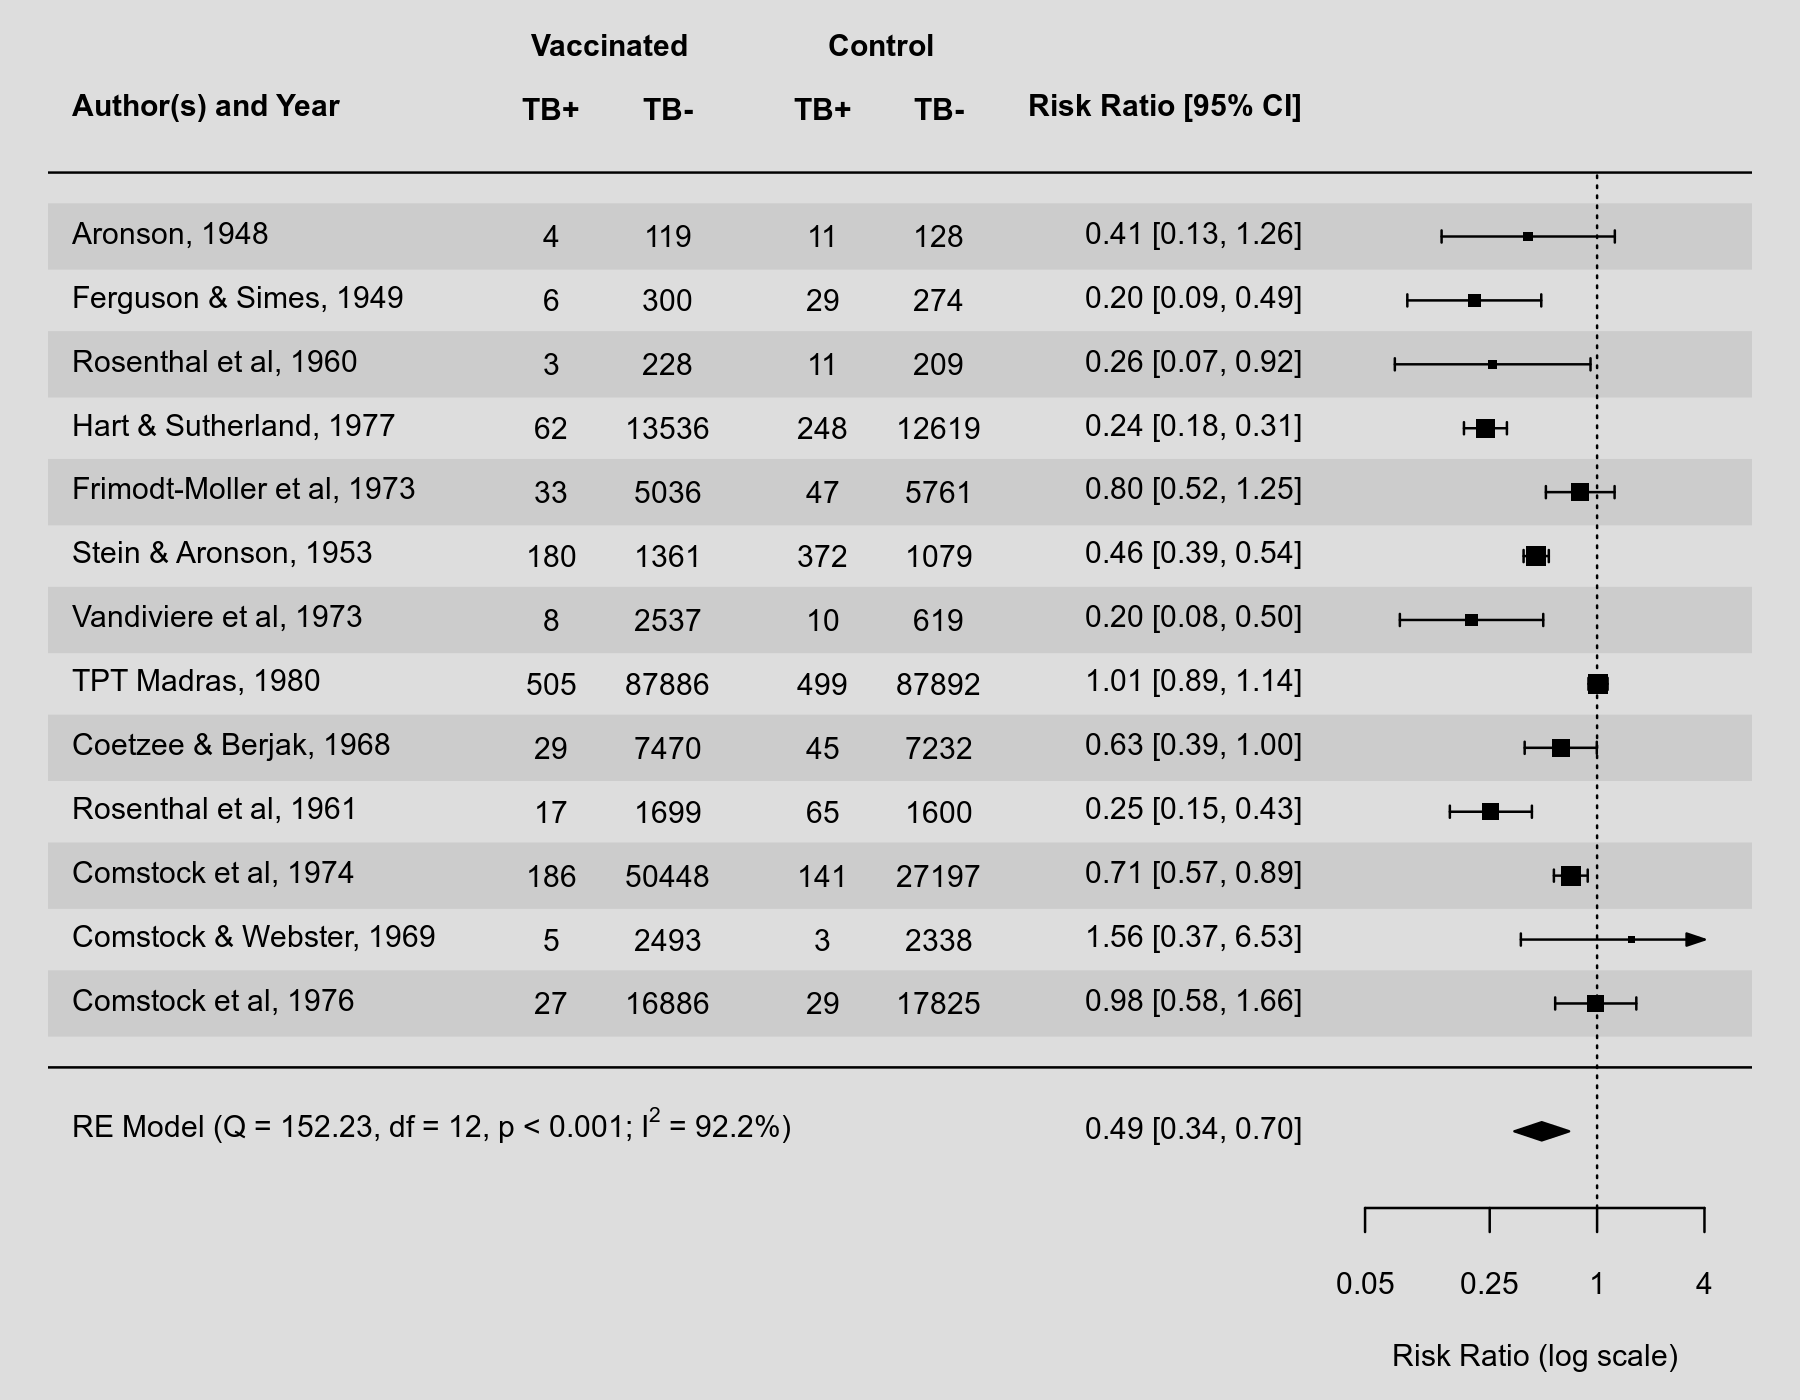
By default, the forest() function places the annotations (giving the study-specific estimates and corresponding confidence interval bounds) to the right of the actual forest plot. See here for an example. Sometimes, we might prefer to show those annotations in a different position. This can be done with the textpos argument, which takes as input a vector of length 2 to specify the placement of the study labels and the annotations. The plot below illustrates the use of this argument.
Plot
Code
library(metafor)

### copy BCG vaccine meta-analysis data into 'dat'
dat <- dat.bcg

### calculate log risk ratios and corresponding sampling variances (and use
### the 'slab' argument to store study labels as part of the data frame)
dat <- escalc(measure="RR", ai=tpos, bi=tneg, ci=cpos, di=cneg, data=dat,
              slab=paste(author, year, sep=", "))

### fit random-effects model
res <- rma(yi, vi, data=dat)

### forest plot with extra annotations
forest(res, atransf=exp, at=log(c(0.05, 0.25, 1, 4)), xlim=c(-20,2),
     ilab=cbind(tpos, tneg, cpos, cneg), ilab.lab=c("TB+","TB-","TB+","TB-"),
     ilab.xpos=c(-13.5,-12,-10,-8.5), cex=0.75, header="Author(s) and Year",
     mlab="", textpos=c(-20,-3.5), shade=TRUE)
text(c(-12.75,-9.25), res$k+2.8, c("Vaccinated", "Control"), cex=0.75, font=2)

### add text with Q-value, dfs, p-value, I^2, and tau^2 estimate
text(-20, -1, pos=4, cex=0.75, bquote(paste(
      "RE Model (Q = ", .(fmtx(res$QE, digits=2)),
      ", df = ", .(res$k - res$p), ", ",
      .(fmtp2(res$QEp)), "; ",
      I^2, " = ", .(fmtx(res$I2, digits=1)), "%, ",
      tau^2, " = ", .(fmtx(res$tau2, digits=2)), ")")))
plots/forest_plot_with_textpos.txt · Last modified: by Wolfgang Viechtbauer